
In my previous role, I supported a Java service that operated similarly to RDP or Citrix by enabling remote UI functionality. This service relied on sessions, which consisted of interconnected Java objects that were supposed to be cleaned up either when a user logged out or after a predetermined timeout period.
During the course of our capacity planning, we discovered a significant memory waste that I wanted to share with you.
Capacity Planning
Part of my routine work with the team included capacity planning for the next year. By analyzing our usage metrics, growth patterns, and population research, our data scientists were able to predict how many users we could expect to have in the coming year.
To determine the necessary infrastructure required to support this anticipated user base, we employed a sophisticated formula:
\[\text{Number of Servers} = { \text{Number of Users} \over \text{Users per Server} } * \text{Safety Buffer}\]To know how many servers we need to have for next year.
One of our capacity planning sessions revealed that, due to the immense popularity of our service, we were anticipating a significant growth in the number of users in the coming year. Our calculations indicated that we would require more servers than we had available to accommodate this increased demand. Consequently, we were faced with the challenge of figuring out how to fit more users onto each individual server in order to support the projected user base.
What are we bound on?
With capacity measurement, we can pinpoint the bottleneck in our system, and in this case, it is the memory. As more users are added to the server, the system begins to falter under the increased load, ultimately running out of memory. Understanding we are memory-bound is crucial, as it directs our efforts towards reducing memory consumption in order to accommodate more users on the server.
Investigating memory usage
We had a crude estimation of our per-user memory consumption using this:
\[\text{Per User Memory} = { \text{Server Memory} \over \text{User Capacity} }\]Using imaginary numbers, we can say something like:
\[\text{Per User Memory} = \text{300MB} = { \text{90 GB} \over \text{300} }\]So we can approxiamte per-user memory requirement as 300MB. In order to understand how to reduce this number, we went into more serious memory measurement.
We began analyzing the Java memory dump of our servers to identify potential areas for improvement. Initially, we reviewed the dumps manually, but due to the sheer number of servers, we developed a custom script to automate the process. Using this script, we were able to identify memory-wasting objects that were attributed to specific sessions. By pinpointing these issues, we can effectively eliminate the waste and optimize our system’s memory usage.
I might cover the script and analysis in another post, but for now I want to focus on a specific quick win the memory analysis gave us.
A very big string
We started with going over our thousands of memdumps and looking for very big objects. Our biggest whale was a 1.5GB string. It looked something like this:
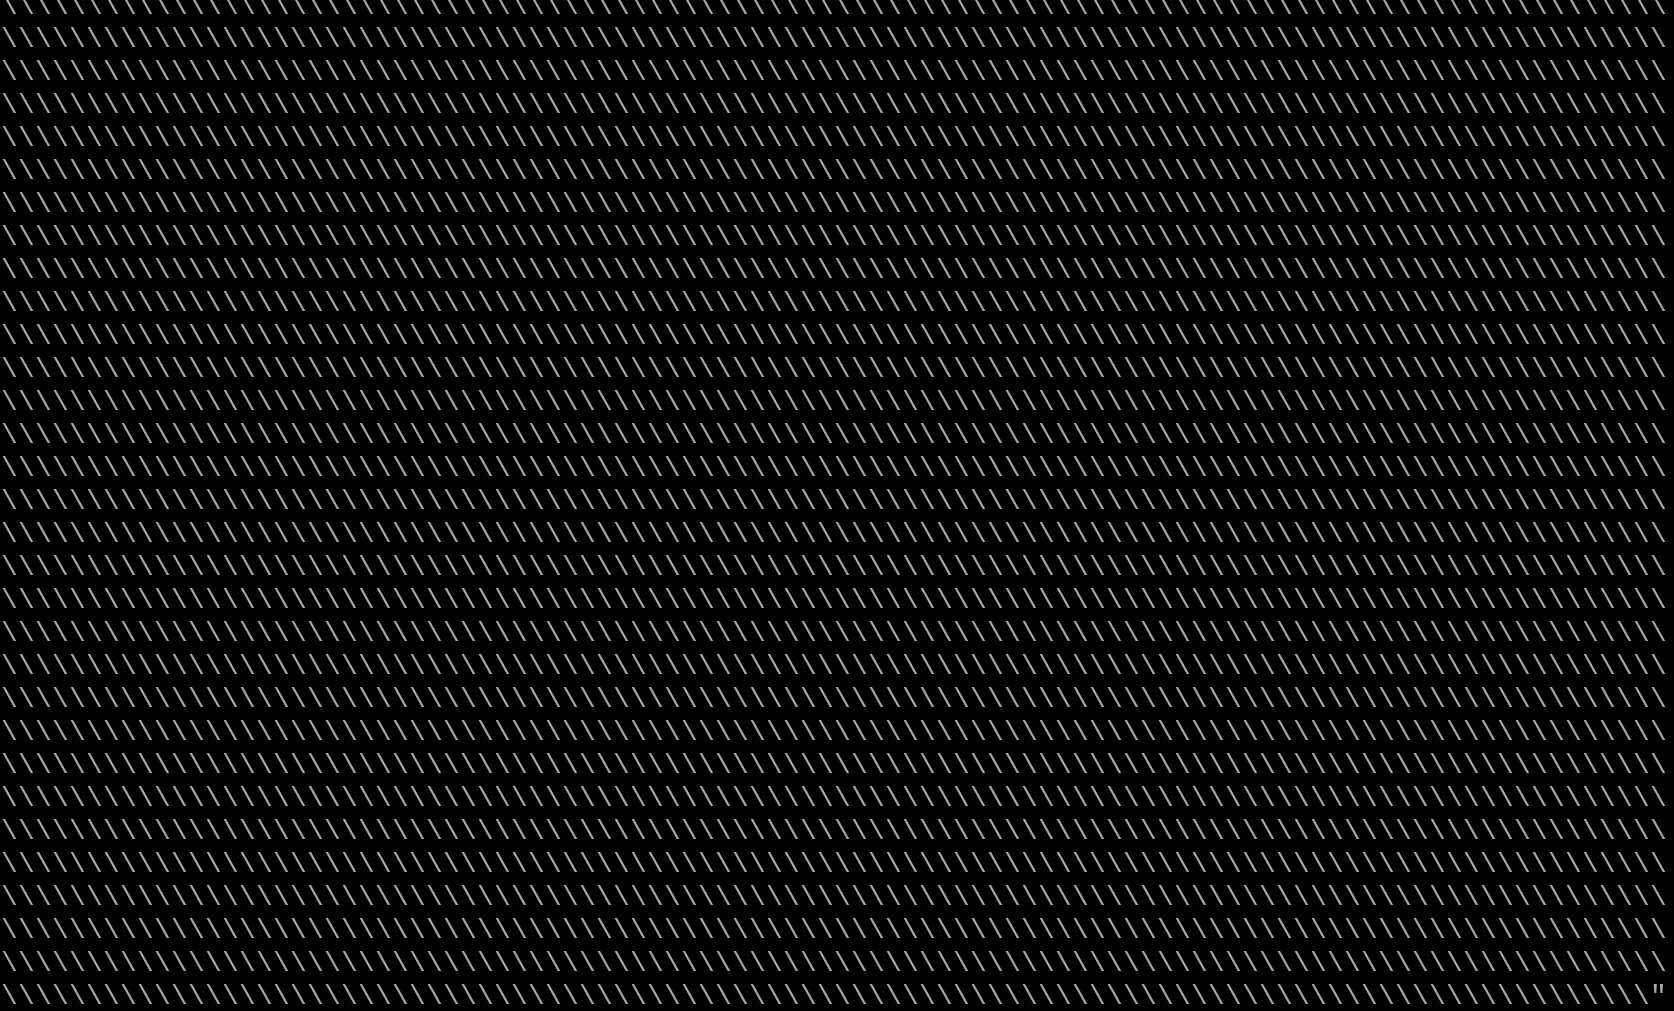
In case the picture didn’t convey the message, the string contained many many backslashes. We found similar smaller ones, but this one was the biggest.
Investigating what the purpose of the string was, I saw that we had classes that looked like this:
class Screen {
  //...
  private Screen previous;

  public String toJson() {
    JSONObject jo = new JSONObject();
    //...
    if (previous != null) {
      jo.put("previous", previous.toJson());
    }
    //...
    return jo.toString();
  }
}

class Session {
  //...
  String currentScreen;

  public void setUrl(Screen s) {
    currentScreen = s.toJson();
  }
}
So each screen has the previous screen the user visited, to allow the user to go “back” and get the exact screen they were in before (state, scrolling position, validation notices etc). The user session also has the current screen the user is in, so if the user reconnects to an existing session, we can return to where they were.
There are two design problems here:
- The “back” stack is unlimited, meaning we’re saving more and more state until we explode
- by running
jo.put("previous", previous.toJson());, we’re converting the JSON dictionary to a string. Since JSON fields have quotes, and those quotes need to be escaped when stored in a string, they are stored as\". That backslash needs to be escaped when this string is stored inside another string, compouding into\\\". A couple more rounds of this, and we get\\\\\\\\\\\\\\\\"
It turns out that a user with a session with lots of screens produced a currentScreen String of gigantic proportions.
Handling and followup
We divided the problem into a quick fix and a long-term one:
The quick fix was truncating the “previous” string if it goes over a specific char amount (e.g. not letting it go over 100MB). While this is not a complete solution and might impact the user experience, it was very quick to implement and easy to test, boosting our reliability (preventing a specific session from inflating and bringing the server down).
The long-term fix was rewriting the “previous” stack solution completely, creating a dedicated real stack with self-imposed size limits and reporting. It took a long time to write, and longer to test and slowly release, but it really prevented memory waste, rather than only hide away whale-strings as another form of memory (e.g. very deep JSON objects).
Epilogue
We continued to use the memory-dump analysis tool and found more nonsense we killed, but nothing as easy as this.
My main takeway from this story is that sometimes, checking the details of how your program uses resources (e.g. examining a memdump rather than just measuring overall memory utilization) is crucial for success and produces quick wins from the start.