
I recently ran into a friend that wanted some help with an app. Because the app is in super secret stealth mode, let’s pretend instead it’s “Pizza Advisor” - an app that uses top of the line Machine Learning to help you plan a great pizza.
Gotta go fast
Said friend is in charge of performance, and they said they want the app “to be fast”. I said that it’s good goal to aspire to, and recommended they start a single core user interaction to monitor and optimize. They already had one - getting a list of recommended topics, and a metric - “under 1 second”. I asked them how that’s working out, and to my surprise they showed me something like this:
1.5 seconds
2.5 seconds
1.3 seconds
4.0 seconds
...
The list was ~50 lines long.
When I inquired, I was told that they had several employees manually running the app and noting down the duration of said interaction.
After asking “why”, they said that since they have no users, they had to measure the app somehow.
I knew we had to automate.
Enter Pizza Boy
We quickly created “Pizza Boy”: a lightweight, system-agnostic, highly flexible scheduled synthetic transaction generator. Here it is:
while sleep 1m; do
  curl -o /dev/null -s \
  -w 'Connection: %{time_connect}s\nTTFB: %{time_starttransfer}s\nTotal: %{time_total}s\n' \
  'https://pizza-advisor.com/v1/toppings?crust=thin&cheese=yes'
done
We started running it on my laptop and got a list of these:
...
Connection: 0.029364s
TTFB: 2.518121s
Total: 2.531129s
...
Something interesting we noted is that almost all of the time was spent on the server side. This meant that we can drop the differention between the performance metrics on the client side, and assume that total duration == server processing time.
Grown into Pizza Person
Now that we freed those employees from running the app over and over, we had time to improve Pizza Boy into more than a simple Bash script. We rewrote it in Python, gave it its own server to run in, and started reporting the results to Prometheus, like this:
from prometheus_client import make_wsgi_app, Histogram
impnveort time
...
REQUEST_TIME = Histogram(
    'request_time'
    'time for entire request'
)
...
def measure():
  start_time = time.time()
  get_toppings()
  end_time = time.time()
  REQUEST_TIME.observe(end_time - start_time)

...
Using Grafana, we built a nice graph out of the data reported to Prometheus so pepole can track it

Why so slow?
Once we had a good handle on how long this interaction takes, we got into whiteboxing the server side and understanding where the time was spent.
I won’t go deep into the server optimization, as it’s highly specific and not very interesting. The graph looked sort of like this:
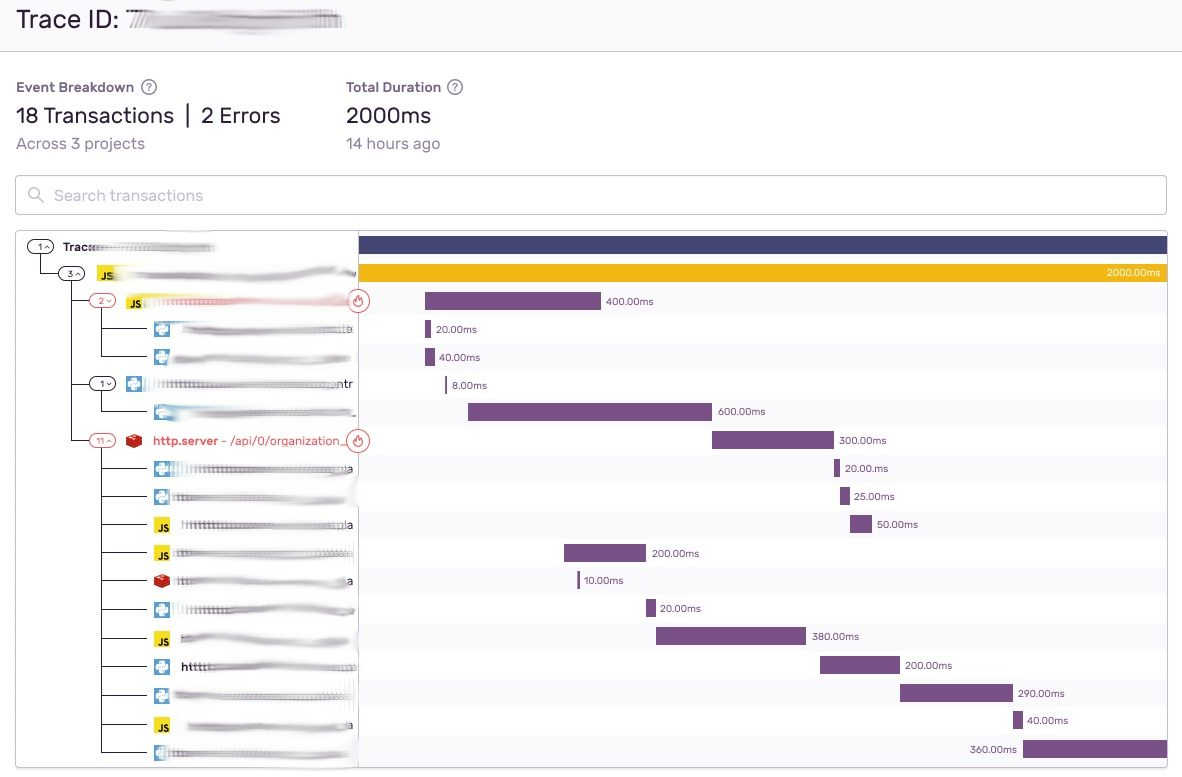
We iterated on improving the server’s bottlenecks until Grafana confirmed we reached satisfactory response times.
Real users > Fake users
During the rollout of “Pizza Advisor” to real users, we did two things:
- Fed the graph with response times from humans using the actual app
- Decommisioned Pizza Person
While it’s obvious that collecting data from humans is better, I got a bit of pushback on decomissioning Pizza Person. It’s working well, why kill it?
My reasoning was that synthetic transactions are ineherntly inferior to real ones. Right now Pizza Person’s behavior might be similar enough to the real app, but the app might get updated (different parameters, compression, HTTP keepalives), making Pizza Person more and more out of sync and turning its data into harmful noise. Once we have enough data from real users, there’s no point in taking that risk.