
Timing Execution By Output Lines
The Story
Today I got annoyed that some puppet agent runs took me over 90 seconds
to complete, even though they actually did nothing (no change was
needed).
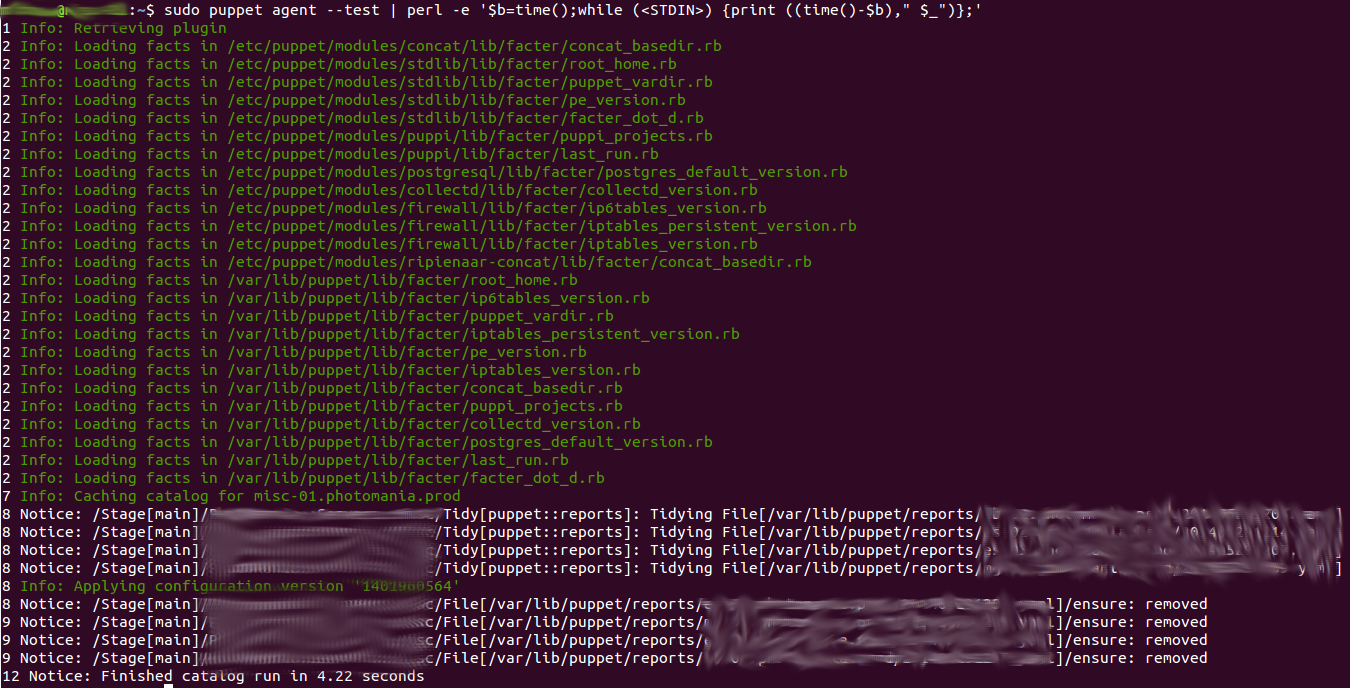
I wanted to see which part of the run took the longest, so I tried this:
sudo puppet agent --test --debug
Unfortunately, I don’t have the ability to follow the terminal for 90 seconds with full attention, so the only thing I recognized was small bursts of text:

Can you follow?
I wished puppet’s output would have timestamps, but there’s no such
feature.
Luckily, I have scripting!
I wanted the solution to be a one-liner (and not a file to be executed)
to keep it portable (as in not having to copy the file to every server).
I considered using awk, python or bash loops, but ended up using perl
because… it gave me the best functionality to code ratio :)
The Script
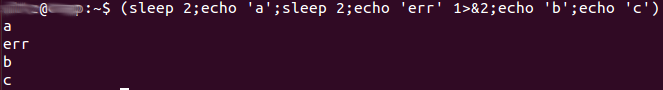
I use this code to simulate a real application:
(sleep 2;echo 'a';sleep 2;echo 'err' 1>&2;echo 'b';echo 'c')
My one-liner will prepend to each line the seconds passed since the script’s start. That way, if you see a large number gap between two lines, you can probably tell what’s wasting your time.
YOURCODEHERE | perl -e '$b=time();while (<stdin>) {print ((time()-$b)," $_")};'

Possible Tweaks
-
Consider using
|&instead of|to pipeline errors (STDERR) too - sometime they’re more informative than the standard output, like this::::bash YOURCODEHERE |& perl -e '$b=time();while (<stdin>) {print ((time()-$b)," $_")};'
-
I really wanted the time measured from the script’s start, and not the computer local time. If you’d rather have that, try something like:
  :::bash
  YOURCODEHERE | perl -e 'while (<stdin>) {print ((scalar localtime())," $_")};'
By the way, puppet’s run took so long due to some SQL queries being run
as part of the puppetdb class.