
Sending HBase metrics to Graphite using Python
The story
Although HBase is a crucial component in our current stack, the monitoring for it was quite incomplete. We only had general “is it running?” monitoring, with some very application-specific tests (“make sure scanning this table doesn’t take too long”).
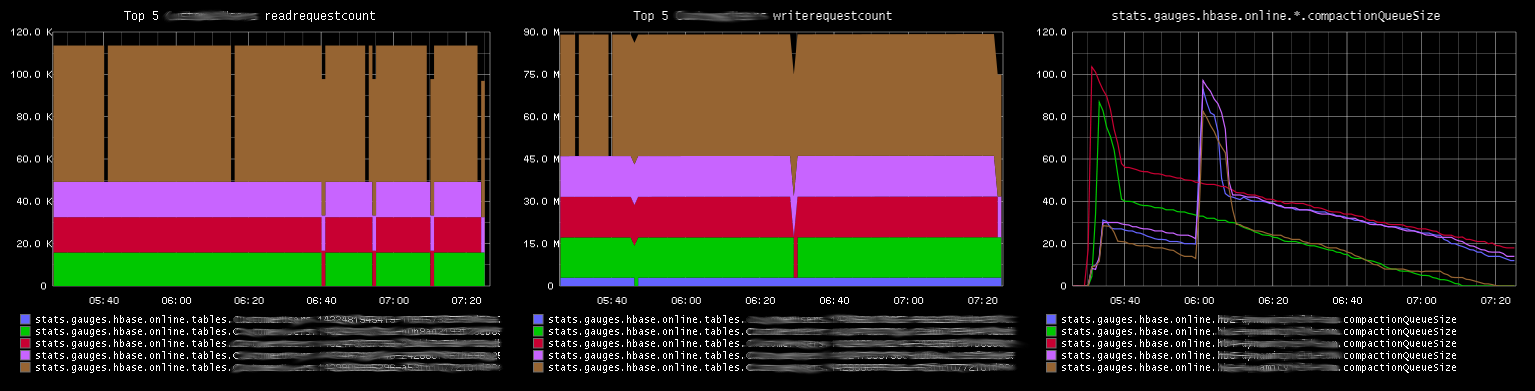
By sending detailed metrics on our HBase tables/regions/servers to Graphite, we don’t only get to monitor these components - we can also detect trends (“Table ABC has 500 regions and yesterday it had 2”, or “This region gets 30 times as many reads as the other ones. Is our key selection wise?”) before they become critical issues. It also makes for very nice graphs.
HBase has several connectors for monitoring available out of the box, but sadly none for Graphite. I saw some projects that can bridge between Graphite and HBase’s JMX interface, but JMX seems really complicated and enterprise-y, and I found I can get everything from the HBase WebUI.
I settled for a Python script that polls the local HBase server webUI every 5 seconds or so, parses the JSON that contains the JMX data, collects interesting (IMO) data and sends it to our StatsD server, which sums everything up and makes sure it gets to Graphite.
The script
I decided to share this project as a GitHub repository.
Check it out!
It includes setup instructions, example usage etc.
Interesting things
- I managed to get JMX to work (mainly because I won’t be defeated by some stupid monitoring framework), but the bother of having a Java project (compiling, installing Java, the JVM overhead…) really takes the fun out of it. It’s also much easier to browse around in the HTTP/JSON endpoint.
- There are many more interesting metrics to be found in this API. I chose mine by stalking our resident HBase expert and noting what he’s interested in when looking in the webUI.
-
Formatting region names is a delicate process, as they’re actually named after the first and last key they’re serving, and there’s no guarantee that keys are printable strings. I managed to get the names to look like the ones on the webUI, but I might have missed something. The relevant code looks something like this:
  :::python
  rawname=v['nameAsString'].encode('unicode-escape').split(',')
  tbl=rawname[0]
  reg=rawname[2].rstrip('.').replace('.','-')
As always, please drop me a line if you find it useful!